Triangle Chart Pattern forms when the stock price moves from wider range to narrow range. It is mostly used chart pattern by many traders. Compared to other chart patterns, this triangle pattern gives clear buy and sell signals.
Additionally, we can easily draw this pattern on our chart and it works in all timeframes. In this article we are going to see triangle pattern types and how to trade this pattern. Let’s dive into the topic.
Table of Contents
What is triangle pattern?
The triangle pattern is a type of chart pattern used in the financial market. This chart pattern helps traders to predict the stock price movements.
Usually this chart pattern forms after the stock price continues movement. So, we can also called this pattern as consolidation pattern.
We can use this chart pattern to find whether the stock price is going to continue the trend or make a reversal.
There are three types of triangle chart patterns, which are mostly used by traders. We will see these three types with examples.

How to find Triangle Pattern?
Let’s see how to find a triangle pattern on our chart. consider there is competition between buyers and sellers. The buyers push the price up and at a particular point, the sellers drag the price down.
They do it continuously before the price reaches the previous support and resistance level. And so the price starts to form a narrow range.
We need to draw two trendlines. One trendline need to touch all the swing high and another trendline need to touch all the swing low. After drawing these two trendlines, we can see the triangle pattern.
After forming a narrow range, at a particular point, it needs to move any one side either up or down. If it breaks upside, the buyers win and the stock price moves in an upward direction or if it breaks downside, the sellers win and the stock price moves in an downward direction.
Three types of triangle chart patterns
We can categorize this triangle pattern into three types. They are,
- Ascending Triangle Pattern
- Descending Triangle Pattern
- Symmetrical Triangle Pattern
1. Ascending Triangle Pattern
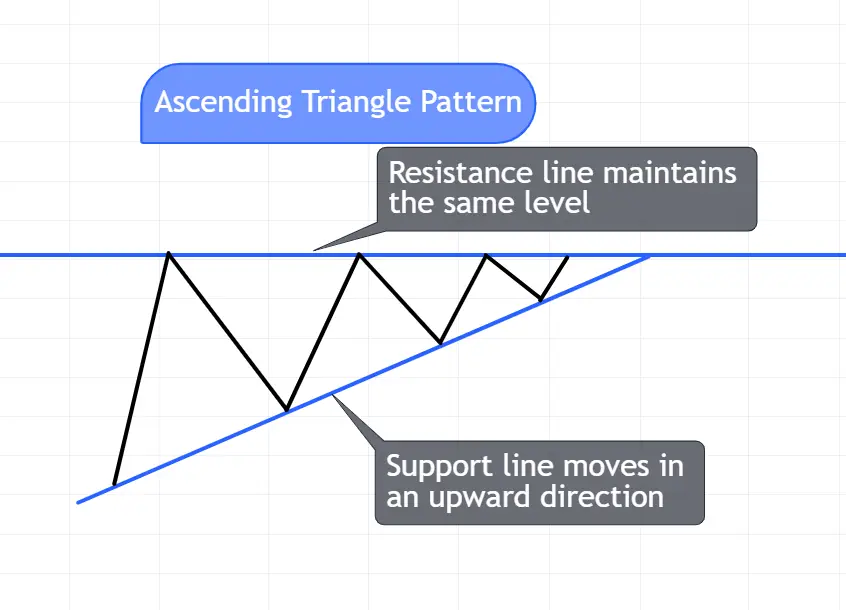
Ascending triangle in technical analysis is always considered as a bullish chart pattern. This chart pattern forms when the support line moves in an upward direction and the resistance line maintains the same level.
Whether it forms in a bull or bear market, if it breaks upside, the stock price may start to move in upward direction.
Features of an Ascending Triangle:
Flat Resistance Line: The upper trendline is flat, showing consistent resistance.
Rising Support Line: The lower trendline rises, indicating increasing buying pressure.
Bullish Breakout: The pattern usually leads to an upward breakout, continuing the bullish trend.
2. Descending Triangle Pattern
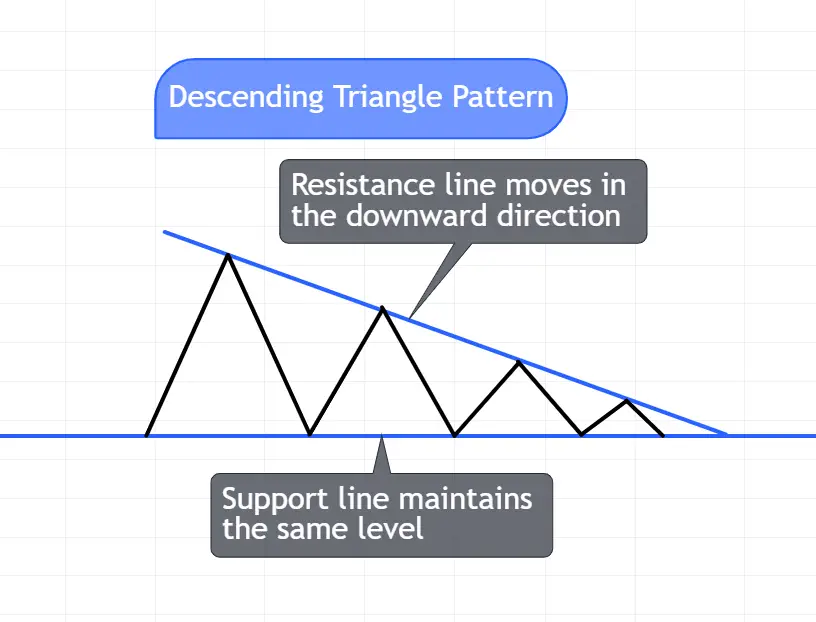
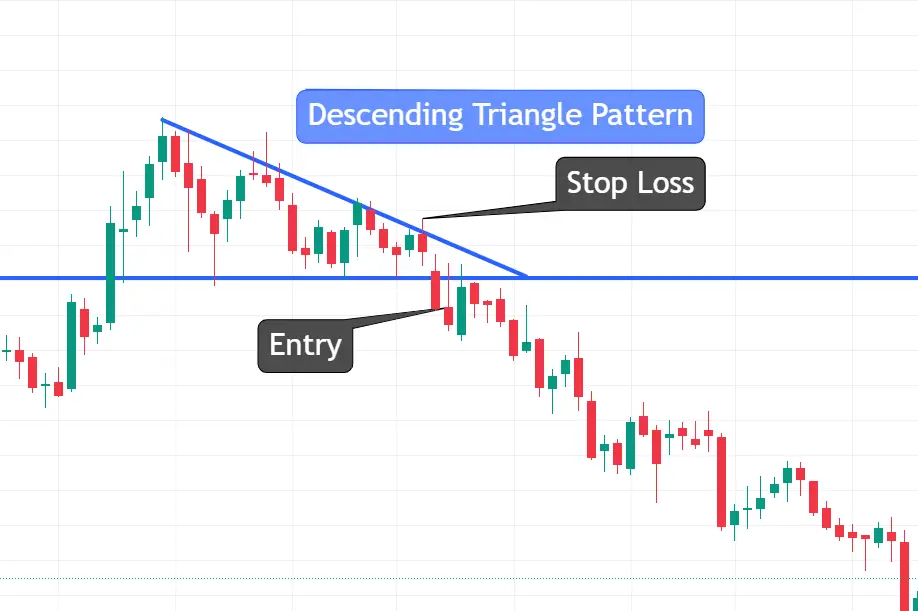
Descending triangle pattern is always considered as a bearish chart pattern. It is directly opposite to the ascending triangle pattern.
It forms when the resistance line moves in an downward direction and the support line maintains the same level.
Also Read: Best 3 ways to identify a market trend with a moving average
Whether it forms in a bull or bear market, if it breaks down, the stock price may start to move in a downward direction.
Features of an Descending Triangle:
Flat Support Line: The lower trendline is flat, showing consistent support.
Falling Resistance Line: The upper trendline descends, indicating increasing selling pressure.
Bearish Breakout: This pattern typically leads to a downward breakout, continuing the bearish trend.
3. Symmetrical Triangle Pattern
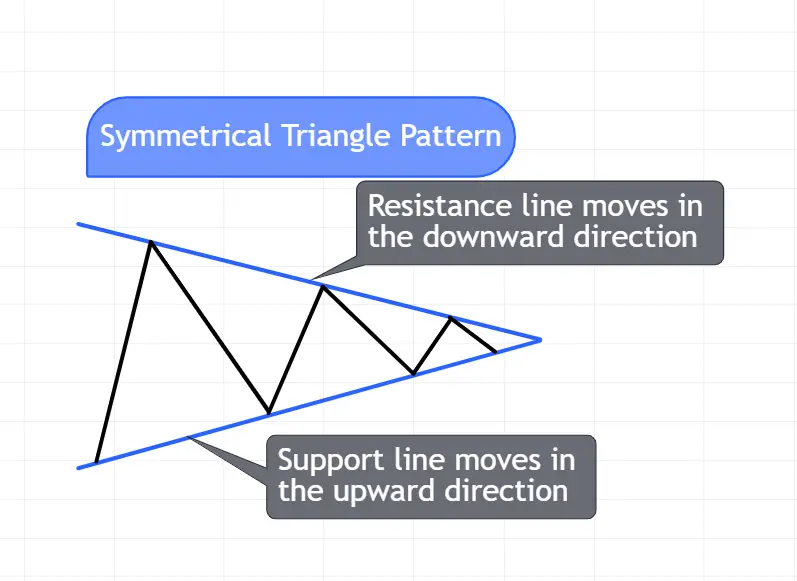
Symmetrical triangle pattern indicates a consolidated phase or indecision phase. It forms when the resistance line, or upper trendline, moves in a downward direction and the support line, or lower trendline, moves in an upward direction.
Indecision phase has chance of breakout in either direction. So we need to wait for confirmation candle.
Features of an Symmetrical Triangle:
Balanced Pressure: The pattern reflects equal buying and selling pressure.
Declining Volume: Volume typically decreases as the pattern develops.
Breakout: The breakout can go up or down and is often accompanied by a surge in volume.
How to Trade Using Triangle Chart Patterns
To trade this triangle pattern effectively, we have to combine the technical analysis with the patience and discipline. We need to follow the following 5 steps to make profit using triangle pattern.
1. Identify the Pattern Early
Finding the triangle pattern early can give us an advantage. Use trendline and connect all swing high and low to recognize the pattern. Watch how the stock price moves inside the pattern.
2. Wait for the Breakout
Chart pattern breakout is very important to make the buy or sell decision. So we should wait for the strong breakout with increase in volume. Once the breakout is confirmed, we can enter the trade in the direction of the breakout.
3. Set Stop Loss
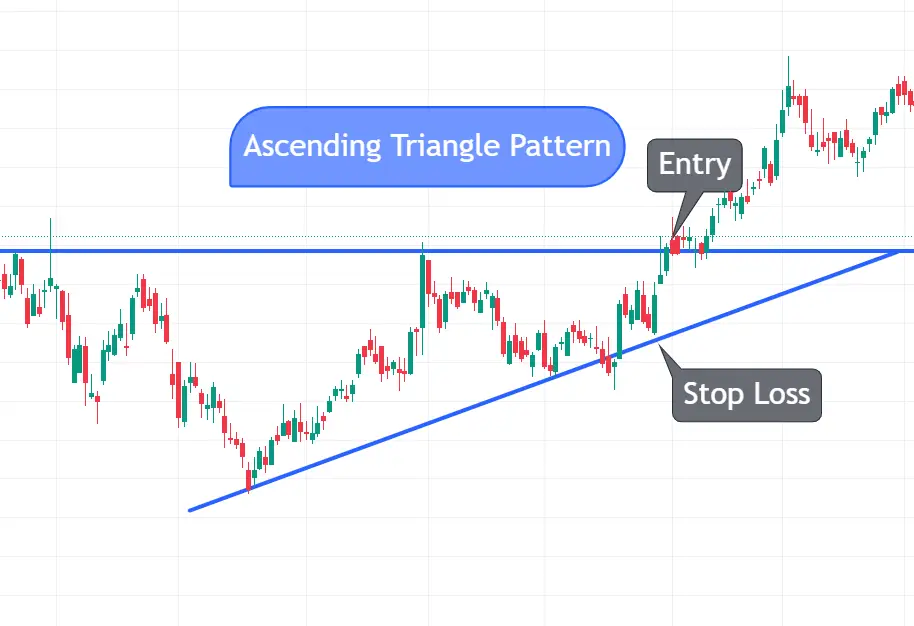
Stop loss is very crucial in every trade to protect out capital from losses. We can place our stop loss in the opposite direction of the pattern. For example, in an ascending triangle, the stop loss should be below the rising support line.
4. Watch the Volume
Volume is very important and it helps us to find false breakout. We need to check the volume of the breakout candle. Breakout with low volume leads to false breakout. So ensure the breakout is supported by increase in volume before enter the trade.
5. Set Profit Targets
We can set profit targets based on our risk management. Also, We can place our target in the next support or resistance level.
Examples for triangle chart patterns
Let’s see some examples for triangle pattern on the chart. Open your charts and try to find and draw these types of patterns. Do many back tests as much as possible before use this triangle pattern trading strategies.
In below figure(a), I drew the upper trendline by connecting the swing highs. It formed a flat top structure. By connecting all swing lows, I have drawn the lower trendline and it is rising above. One bullish candle broke the resistance level and the stock price started to move high. This is the best example of an Ascending Triangle Pattern.
In below figure(b), I drew the lower trendline by connecting the swing lows. It formed flat bottom structure. By connecting all swing highs, I have drawn the upper trendline and it is falling down. One strong bearish candle broke the support level and the stock price started to fall with strong momentum. This is the best example for Descending Triangle Pattern.
In below figure(c), I drew the upper trendline by connecting the swing highs and By connecting all swing lows, I have drawn the lower trendline. One strong bullish candle broke the upper trendline level and the stock price started to raise up with strong momentum. This is the best example for Symmetrical Triangle Pattern.

Triangle pattern is the best price action chart pattern used by many traders. During market consolidations and breakouts, we can use this trading strategy to enter the good trade. Understanding the different types of triangle pattern help us to improve our trading skills. Along with this chart pattern we have to use proper risk management to increase our winning probabilities.
FAQs
Is triangle pattern bullish?
Ascending triangle pattern is the bullish chart pattern. It also indicates the reversal. We can find it using the breakout direction. Whereas descending triangle is the bearish chart pattern.
What is a bullish symmetrical triangle pattern target?
Symmetrical triangle pattern indicates the indecision. Based on the breakout direction we can decide it is bullish or bearish. The target for the symmetrical triangle pattern should be next resistance or support level.
How many touches are needed for a triangle pattern?
Perfect triangle pattern needs at least five touches. Two touches in the upper trendline and three touches in lower trendline or vice versa.

Pingback: Breakout Retest: Best Price Action Trading Strategies for Consistent Profits - Senthil Stock Trader
Pingback: 5 Tips to Use Volume in Trading for Consistent Profit - Senthil Stock Trader