In this post, We are going to talk about the Breakout Retest Trading Strategy. It is one of the most effective trading strategies that I have been using for 7+ years in the stock market. This is the perfect price action trading strategy and can be applied to both swing trading and day trading.
Are you ready to learn how this strategy works? I will show how to apply it in your trading with charts and will also share important tips and tricks that will help you to master in this strategy.
Table of Contents
What is the Breakout Retest Trading Strategy?
Breakout retest is a mostly used price action trading strategy. In this strategy, we have to identify the key support & resistance level on the chart and use that levels to make profitable trades.
- Support Levels: It is like a safety net. It prevents price from falling further.
- Resistance Levels: It acts like a ceiling. It stop price from rising higher.
If the stock price breaks these support and resistance level, it will give good price movement either upward or downward based on the breakout. After this breakout, we can often see the retest. And we need to use this retest for good entry.
Why is the Retest Important?
At first every breakout might look good, but all breakouts are not equal. Some breakout works well and some failed. To avoid getting into the failed breakout, we can use the retest technique.
After breakout, most of the time the stock price touch that breakout level and continue the price movement with good momentum. We have to wait for that retest to spot the good low risk entry.
How Does the Breakout Retest Strategy Work?

In the above fig(a), we can clearly see the stock price moves in a sideways range.
Let’s draw the two horizontal lines. One is by connecting all the lows and another one is by connecting highs. Now we get the support & resistance level.
The stock price breaks the resistance level and the price started to raise. This is how breakout happen. Let’s explore how the retest works with some real chart examples.
Also Read: How to Trade Triangle Chart Pattern
Example 1: Breakout Retest in BERGEPAINT Stock
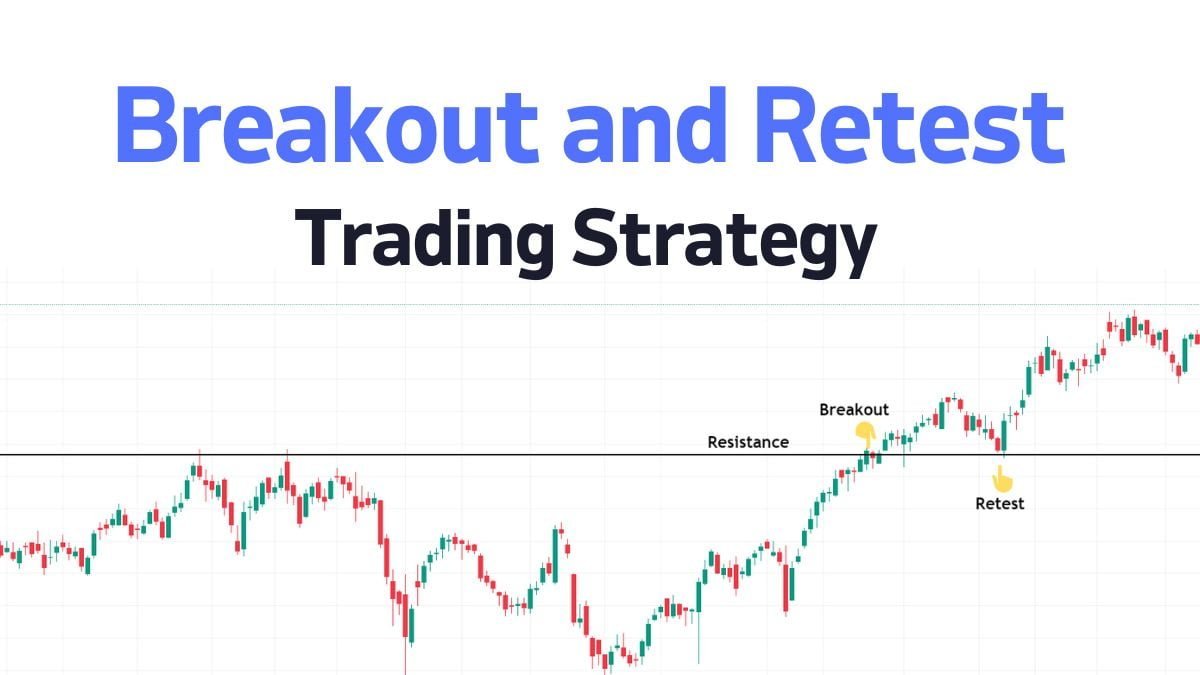
Look at the below fig(b), It has one important resistance level, and a strong green candle broke that resistance level. After the breakout, the stock price started to move in an upward direction.
After a few days, the stock price fell down and took support at that breakout level. Now that the resistance level acts as the support level, after taking a retest on the support level, the stock price started to raise in the upward direction.
Again it fell down and took support on that support level, and this is best example for retest. After this retest, it once again started to raise in an upward direction.

Entry and Stop loss
So where do we need to enter?
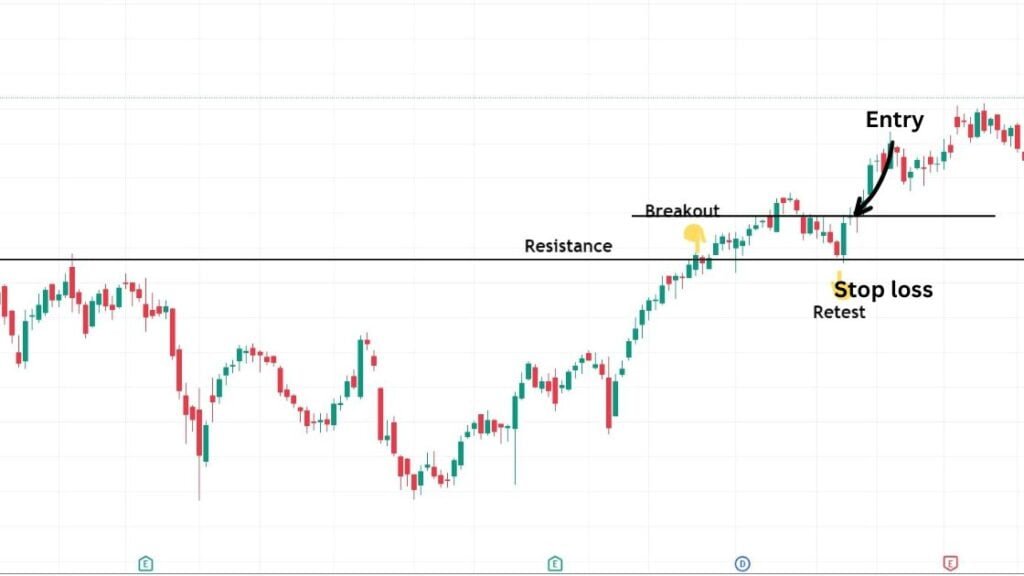
Look at the below fig(c), after the breakout the stock price took support at the breakout level. We can enter at that level. We have to put stop loss below the support level. One of the best advantages of this retest strategy is we can put tight stop loss.

Example 2: Breakout Retest in PUNJAB NATIONAL BANK Stock
Let’s explore another example. In this below chart fig(d), I drew the resistance level and one green candle broke that resistance level strongly.
After that breakout, the stock price moved in an upward direction. After a few days, it started to fall down and reached the previous that breakout level.

Entry and Stop loss
Now that resistance level acts as the support level, so at that resistance level, it took the retest. We can make an entry if the price breaks the high of the retest candle. We should place our stop loss below the support level.

Example 3: Breakout Retest in INDUSIND BANK LTD Stock
The below chart fig(f) is another best example for the breakfast and retest strategy. The green candle breaks the resistance level which I drew. After breakout, the stock price moved in an upward direction and fell after a few days, then took a retest.

Entry and Stop loss
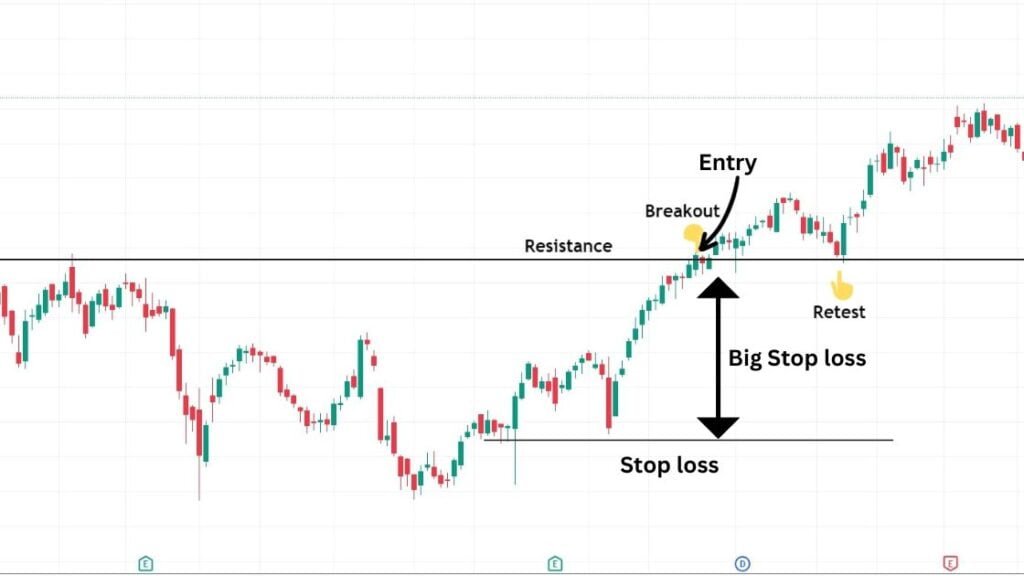
We can also make an entry on the breakout level, but if we take an entry there, we must put the stop loss below the swing low. In the below chart fig(g), we can clearly see the stop loss level. The price difference between the enter price and stop loss is huge.

So we need to wait until the retest happen. After the retest, we can enter the stock with tight stoploss.

Advanced Tips for Breakout Retest Strategy
- Volume Analysis: For strong confirmation, use volume indicator. Success ratio will increase, if breakout retest happen with strong volume.
- Risk Management: Before entering the trade, calculate the risk reward ratio. We have to set a tighter stop loss for better risk management.
- Multiple Time Frames: Analyse the key levels and breakout in multiple time frames for strong confirmation.
Common Mistakes to Avoid
- Ignoring the Retest: Don’t enter immediately after the breakout. Calmly wait for the retest for good trade.
- Overlooking Market Conditions: Check the overall market conditions. Breakouts might fail, if the market conditions is not good.
I hope you learn the breakout retest trading strategy. Remember, practice makes perfect, so start small until you feel confident with this method. If you found this article helpful, please share it with your trading friends and leave any questions or comments below.

Pingback: Breakout Trading Explained - Senthil Stock Trader
Pingback: 5 Tips to Use Volume in Trading for Consistent Profit - Senthil Stock Trader