If you are starting to learn trading, definitely you heard the word volume. But I saw many beginner traders get confused about how to use volume in trading.
Volume indicators are available on every trading platform. But you have to learn how to use the volume indicator along with the stock price.
5 tips in this article will help you to learn to make consistent profit using volume. It will increase the winning ratio of your trade.
Let’s dive into the actionable tips.
Table of Contents
1. Identify Breakouts with Volume Spikes
We know how fuel is important to move the vehicle. Likewise, in trading, volume plays a vital role for the stock price movement.
Many beginner traders just learned breakout trading strategies and started to enter the trade when they identified breakout.
If you are the one, just stop it.
Check the volume of the breakout candle and compare with the previous volume. If it is higher than the average volume, it is the confirmation signal.
It means the big players are on board and the stock price is going to rise up with strong momentum.
Also Read: Breakout Retest Trading Strategy
Let’s see a real-time trading examples,
WOCKPHARMA Daily Chart:
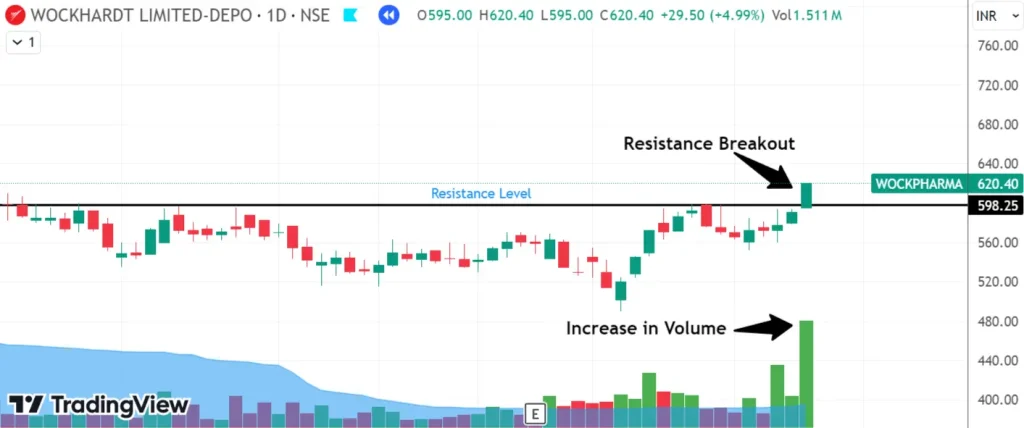
In the WOCKPHARMA daily chart, you can see the resistance level, right?
This is the strong resistance level. Take a closer look, can you see the breakout?
Now check the volume in the bottom. Can you see how the volume is increasing?
This is a strong confirmation signal to enter the trade.

Well, after this strong breakout, the stock price shot up around 59% with good momentum.
JAIBALAJI Weekly Chart:
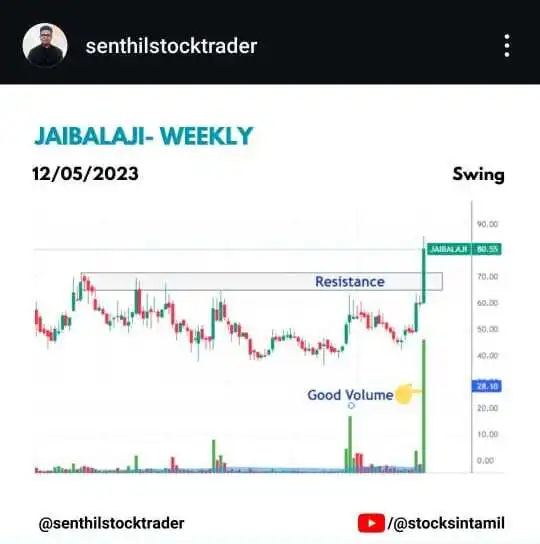
In my Instagram account, I posted this stock on 12 may 2023. Can you see the resistance breakout with good volume?
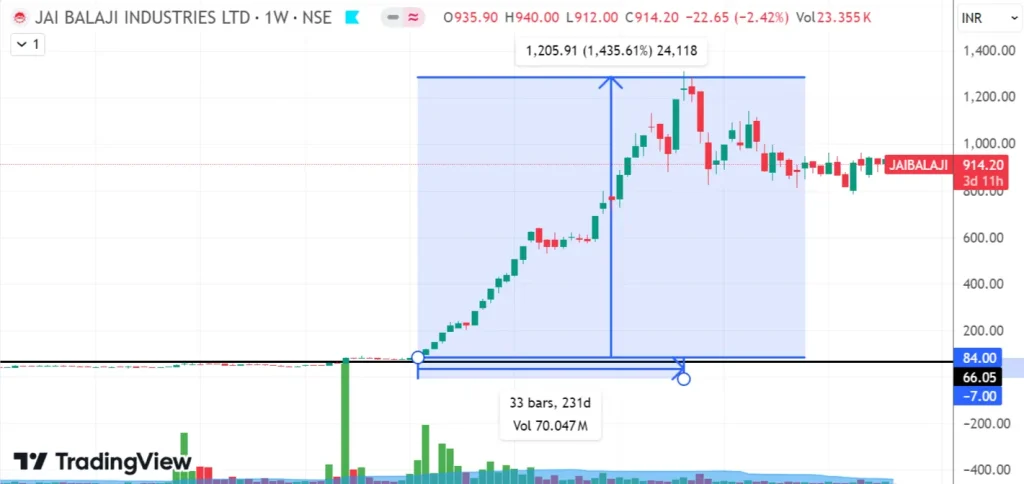
Can you see the huge price movement?
After this strong breakout, the stock price shot up around 1435% in just 7 months. This is the power of breakout with strong volume.
So, hereafter whenever you identify the breakout, make sure to check the volume before enter the trade.

Chart image source: Tradingview
2. Use Volume in Trading to Spot False Breakouts
Main cons of breakout trading strategy is false breakout. Imagine, you take one stock, draw a resistance line and wait for the breakout.
As you expected, the stock price broke the resistance level. What will you do?
Many beginner traders get excited and enter into the trade without second thought. When I was a beginner, I often made this mistake.
After the breakout, the immediate next candle falls into the resistance level and the price starts to reverse. Many traders experience the pain of reversal due to false breakout.
You can use the volume to identify the false breakout and avoid the trade. But how?
During the breakout, check how volume reacts to that breakout. If the volume is weak, it might be a false breakout. The price could reverse soon.
Also Read: Triangle Chart Patterns
Let’s see real time example for false breakout,
POWER FIN CORP LTD Daily Chart:
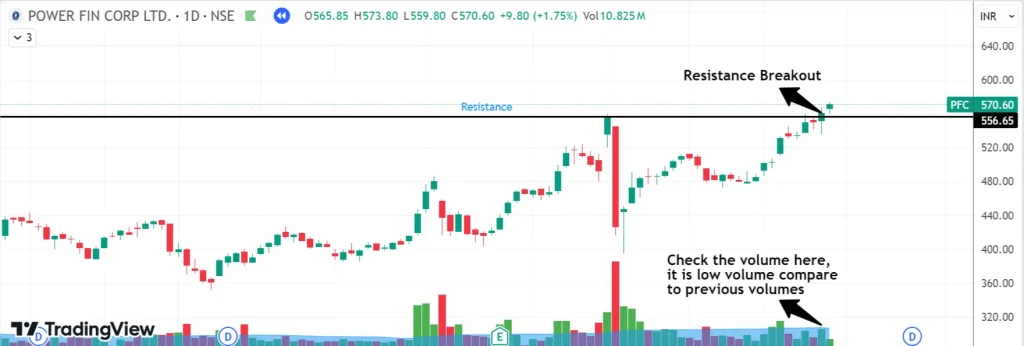
Can you see the resistance line at 556.65 price level?
The stock price broke that resistance level and closed above the line. Next candle opened and closed above the resistance level.
So according to breakout strategy, it is the confirmation signal to enter into this stock. Am I right?
But also check the volume, compared with the previous volume, it is low.
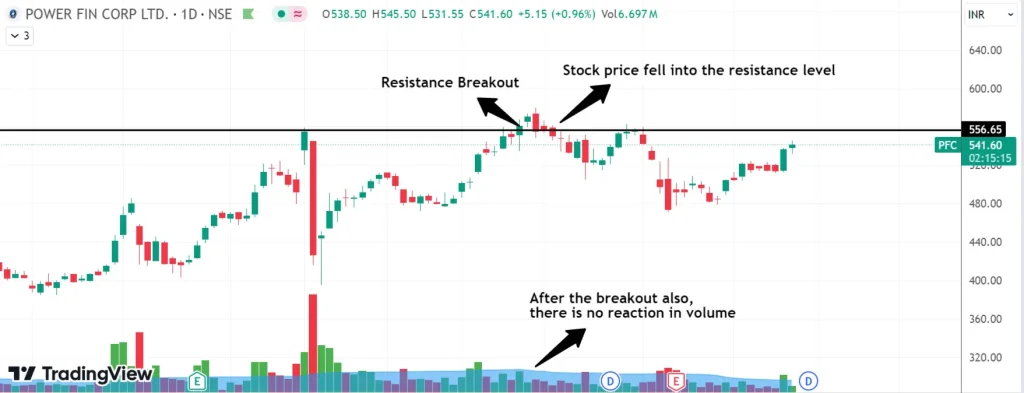
Now can you see what happened after that breakout?
Due to low volume, in other words, due to no buyers the stock price failed to continue the upward movement and fell into the resistance level.
So, this is the best example for false breakout.
SBI CARDS Daily Chart:
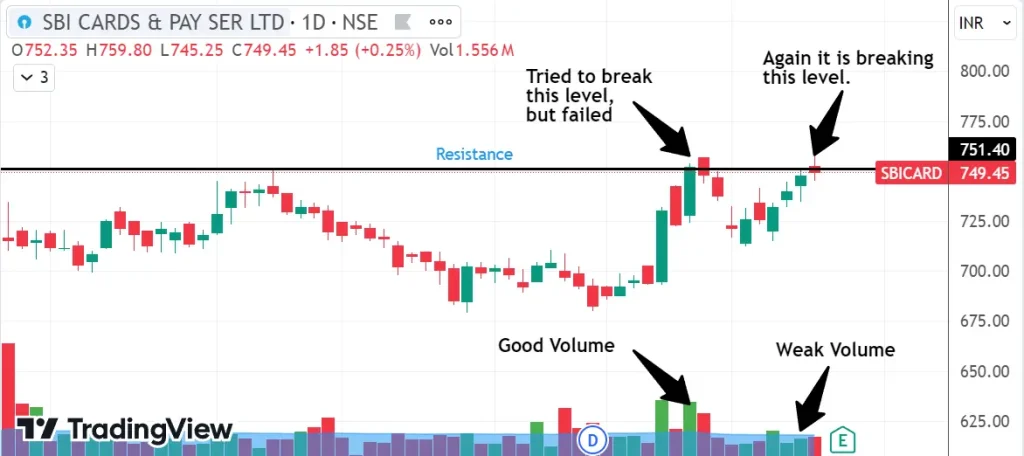
Actually, I took a trade in this stock.
This stock price tried to break the 749.45 resistance level but it failed and fell down.
Second time it formed Higher Low and tried to break that level again. So I thought and spoke to myself – “hey, it’s again trying to break the resistance level. So it is going to fly”.
And I took the trade. I entered at the high of the last candle. But one sad thing is I didn’t check the volume.

The next day, a Doji candle formed, followed by a red candle. On the third day, something worse happened. Can you spot it on the chart?
Yes, its gap down and seller volume also high. So after seeing this gap down and heavy volume on sell side, I exited from this trade with small loss.
So what I learned from this trade and what you need to learn from my loss?
You need to check how volume reacts during the breakout stage. If there is low volume you have to avoid that trade.
Also if you entered in any bad trade, you should cut the loss quickly.

Chart image source: Tradingview
3. Use Volume to Confirm Trends
I know you surely come across the word – “Trend is your friend”. It means you should follow the trend for a high winning percentage.
Going against the trend will hit your stop loss often.
If the trend is strong, you can enter a trade on every pullback. But here, you need to determine whether the trend is strong or not.
To evaluate the strength of trend, whether its uptrend or downtrend, you can use the volume.
If the volume increases when the stock price moves up, it is a good uptrend. The price will continue the movement in that direction.
But during price increases, if the volume decrease, it means the trend is weak and in any time stock price direction might reverse.
Using this activity in volume, you can confirm the trends.
Lets see few examples in chart,
ITC LTD Daily Chart:
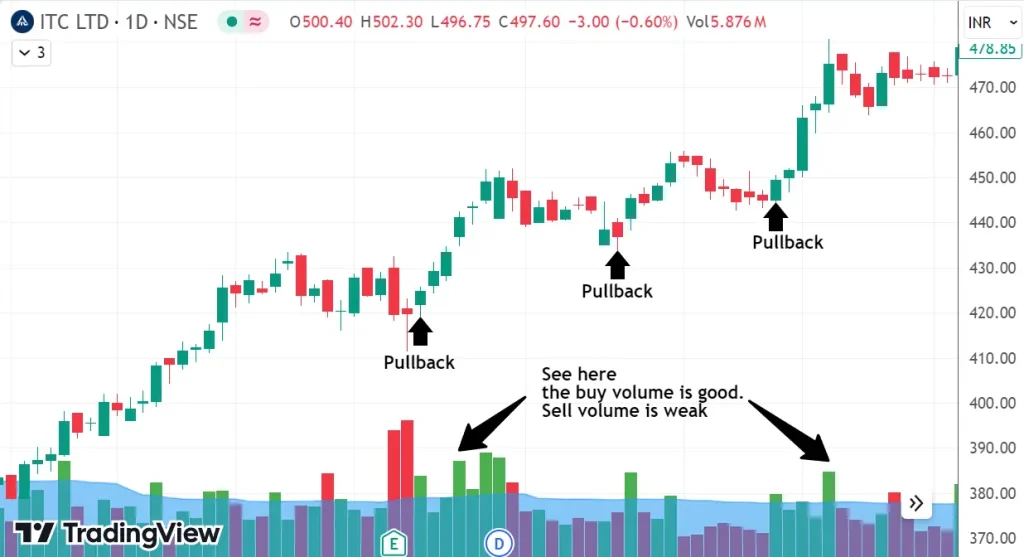
This stock price is in a good uptrend. Can you see it? The stock is continuously forming Higher high and Higher Low.
Now see the volume. The buyer volume is high compared to the seller volume. Also the volume is increasing on every pullback.
So if volume increases along with the price, we can say, the stock price is in good uptrend.
OBEROI REALTY LTD Daily Chart:
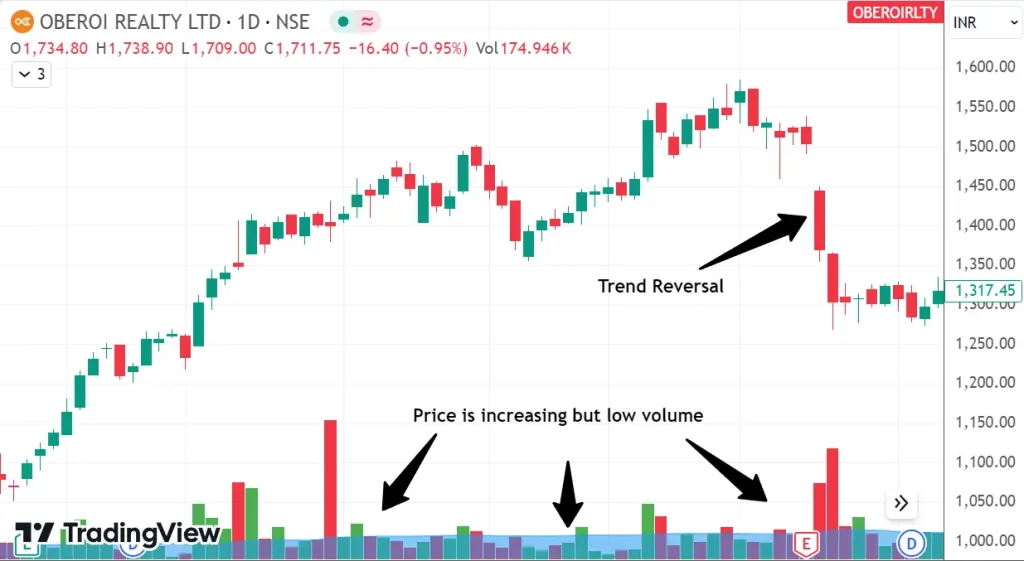
The stock price is increasing but check the volume. There is no support from the volume.
The low volume clearly says that there is no buy from big players. So at any time the stock price started to fall.
And as you can see, the stock price started to change direction with a huge gap down.
So if you see any stock price increase with low volume, you need to be cautious to take the trade.

Chart image source: Tradingview
4. Volume and Support/Resistance Levels
When the stock price reaches the support or resistance level, it has two choices. It has to break the level or reverse from that level.
Can we figure out what will happen near support/resistance level? Yes we can. But how?
By using volume, we can predict whether the stock price is going to break or reverse.
If the volume increases when the stock price approaches the support or resistance level, it will give a breakout.
But if low volume decreases or no volume, the stock price will reverse from that level.
Let’s examine a few example in chart,
COLGATE PALMOLIVE LTD Daily Chart:
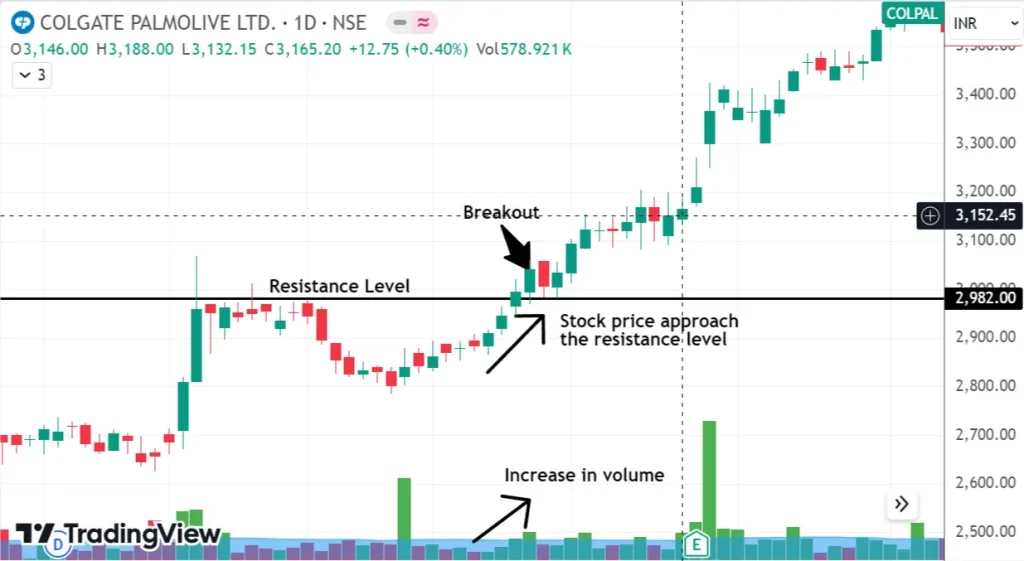
The stock price hovered near the resistance level for 9 days, then dropped continuously for 6 days.
But can you see it? During the fall, there is no heavy seller volume. After 6 days again it started to rise up.
This time the buyer volume increases when the stock price approaches the resistance level.
This is a good signal for us to expect the breakout.
As expected the stock broke that resistance level and started to rise with good momentum.
NATIONAL ALUMINIUM CO LTD Daily Chart:
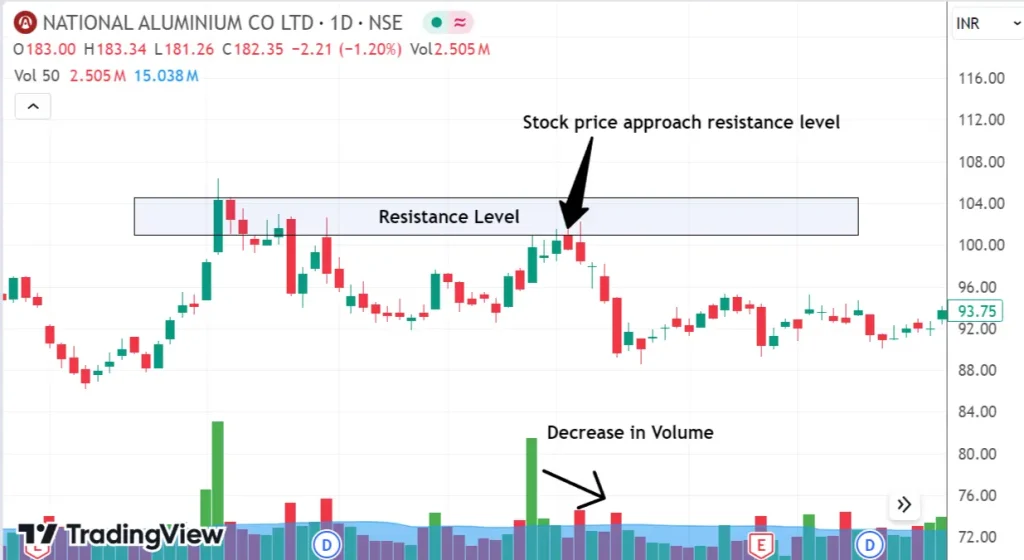
This example is directly opposite to the previous one.
Here you can clearly see, the volume decreased when the stock price approached the resistance level.
As already said, it got rejected from the resistance level and started to fall down.
These two examples showed you how volume is important to analyse the stock price near the support and resistance level.

Chart image source: Tradingview
5. Watch for Volume Divergence
What is Volume Divergence?
Let’s say the stock price is making a higher high, higher low or lower high, lower low but the volume started to decrease. This is called volume divergence.
So, if the volume starts to decrease, there is a high chance for the reversal. So, you need to be cautious at that time.
Let’s see it in real time chart,
AMBUJA CEMENTS LTD Daily Chart:
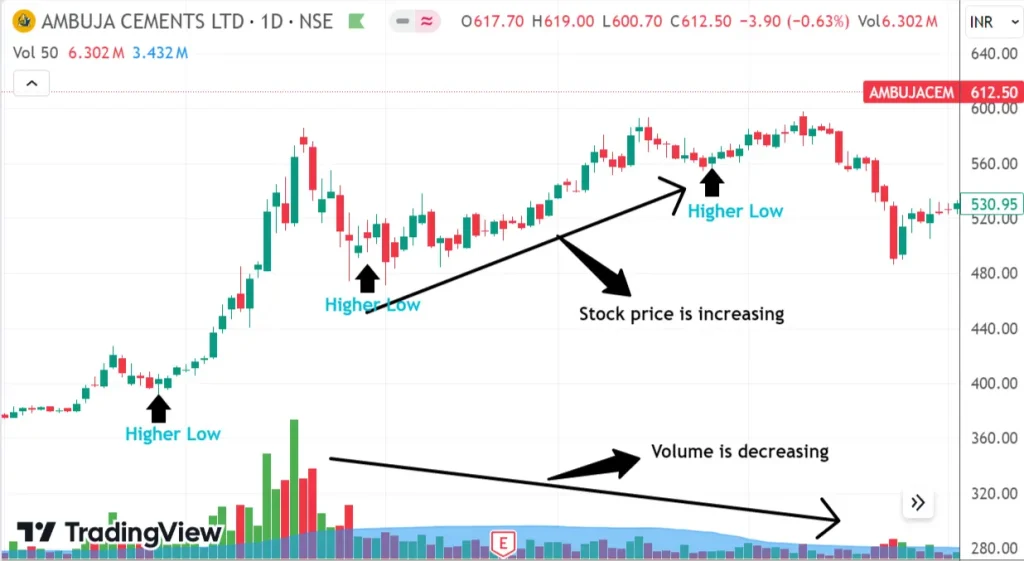
This stock formed Higher High and Higher Low and it was in a good uptrend. Am I right?
Now see the volume along with the price movement. The volume is decreasing while the price increases. Here volume divergence is happening.
As already said, if you see any volume divergence like this, you need to be cautious.
After the stock price reached the previous high level without volume, it started to fall heavily.

Chart image source: Tradingview
Now it’s your turn
Remember no indicator is fool proof. But if you combine volume with your strategy, it will have an extra edge in your system.
I hope you learned how to use volume in trading. And I believe it will help you to make consistent profit.
Do you use any of this method in your trading already? How did it work for you?
Which tips are you going to try first?
Or do you have any questions from these tips?
Share your thoughts in the comments below!
