In this article, I am going to share the 3 powerful moving average strategies for trend analysis. I hope you may have already heard the quote “Trend is your friend”. It means if you follow the trend of the stocks and take entry along with the trend, there is a high chance to make a profit.
Going against the trend is like riding a bicycle against the wind. It isn’t easy to make a profit. The moving average trend analysis method will help you to take good trade.
The moving average is a simple and powerful indicator. It calculates the average price of the stock over a specific period of time. It moves along with the stock price and thereby it gives a clear picture of stock price movement.
Other methods are also there to identify the market direction like trendlines, but if you are a beginner, moving average will be very useful for you to identify the trend.
Table of Contents
Moving average slope
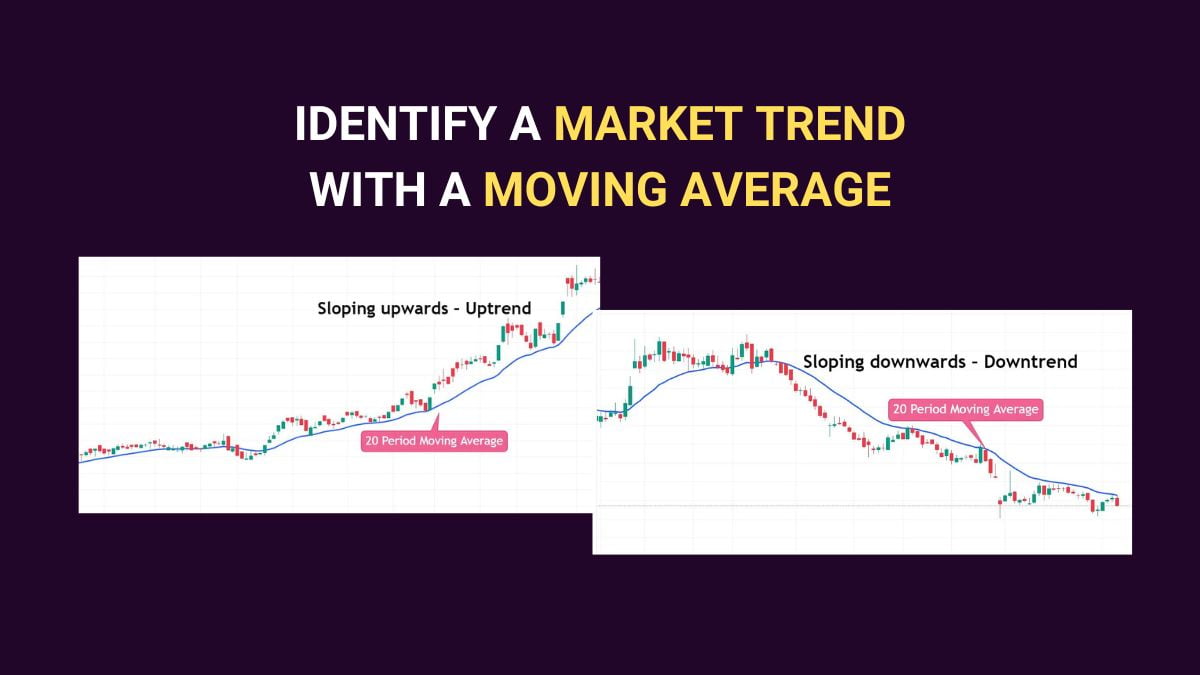
Based on the slope and direction of the moving average we can find the trend of the particular stock. If the moving average is sloping upwards, then you can consider it an uptrend. Likewise, if the moving average is sloping downwards, then you can consider it a downtrend.
Sloping upwards – Uptrend
Sloping downwards – Downtrend
Please check the below charts. In the first chart the moving average is sloping in an upward direction along with the price and the second chart clearly shows the picture of a downtrend. Here I plotted the 20 SMA. You could use 20 or 50 SMA to find the trend.


Support and Resistance Moving Average Strategies
Do you know the moving average also acts as support and resistance? You can do pullback trading using this technique, but it is a different topic. I will write another article about this pullback trading technique. Here you have to add one price action technique along with the moving average, that is you need to find swing high and swing low.
Also read this: What is IPO?
First, we see the uptrend, if the stock price is above the moving average, then that moving average acts as a support level for that price. Please take a look at the below chart. The stock price rose above the moving average and after a few candles, it came down and took support at the moving average. Again it rose and broke the previous swing high. This is the ideal example of an uptrend.

If the stock price moves below the moving average, then that moving average works as a resistance level for that price. Now have a look at the below chart. The stock price fell below the moving average and after a small movement, it rose up and touched the moving average and again fell down. Here it broke the previous swing low.

Cross Over Moving Average Strategies
For this method, you need to use two moving averages with different periods. This is the most important moving average trend analysis method. You could use 10 and 20-period moving averages or 20 and 50-period moving averages. If the short-period moving average stays above the large-period moving average and moves in an upward direction, you can consider it a BULL trend. Same as if the short period moving average stays below the large period moving average and moves in a downward direction, you can take it as a BEAR trend.
If you use the 10 and 20-period moving averages and stock price moves above the 10-period moving average, you can take it as a strong trend. Please check the below chart, these charts are ideal examples for the BULL and BEAR trend.


I hope now you know the moving average trend analysis method to find the stock price trend. I add one more point here: if the moving average is in a flat position, then it means the stock price moves in a sideways direction. It is better to avoid trading in sideways stocks. Please keep in mind these moving average techniques are only to find the direction of the stock price. It is not a strategy, you could use this technique along with your trading strategy.
